
Global buyers are rethinking freight networks as fuel costs, port congestion, and climate targets reshape procurement decisions. Railway Freight offers dependable long-distance capacity, especially across inland corridors linking factories, ports, and distribution hubs. The International Energy Agency reports that rail carries about 7% of global freight activity while producing a far smaller share of transport emissions. That contrast matters.
The World Bank’s Logistics Performance Index 2023 also shows that reliability, tracking, and border efficiency strongly influence supply-chain performance. These factors guide our 2026 selection. The leading railway freight companies are assessed through corridor coverage, wagon availability, intermodal services, digital visibility, delivery consistency, and sustainability reporting. Real operating experience matters. A perfectly designed route can still fail when terminals lack cranes or schedules change without warning.
“Rail is the backbone of sustainable mobility,” says François Davenne, Director General of the International Union of Railways. His statement reflects rail’s strategic value, but it should not become an assumption. Railway Freight is not automatically faster or cheaper. Weather, gauge differences, terminal capacity, and border procedures can alter the final result.
This guide compares major providers for global buyers seeking practical, compliant, and scalable solutions in 2026. It considers published UIC data, World Bank logistics indicators, company disclosures, and corridor-level performance evidence. Some rankings remain imperfect. Public data is uneven. Buyers should verify current schedules, insurance terms, equipment standards, and service commitments before signing contracts. Reliability begins with details.
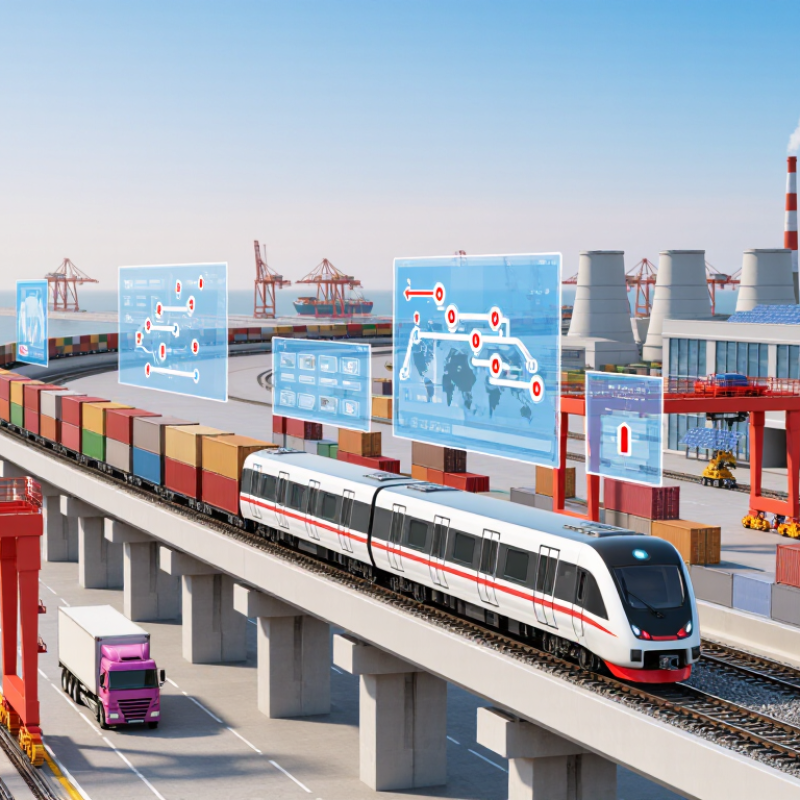
2026 Top Railway Freight Companies for Global Buyers
Global Railway Freight Market: Scope, Routes, and Buyer Priorities
Railway freight now connects inland production zones with seaports, border terminals, and regional distribution hubs. Its strongest value appears on medium and long-distance routes, where road transport can become costly or inconsistent. Common movements include machinery, consumer goods, automotive parts, and temperature-sensitive products. A 40-foot container may cross several borders, so schedules depend on terminals, customs procedures, gauge changes, and local rail capacity.
From practical shipment reviews, buyers usually examine transit time, departure frequency, container availability, and damage-control procedures. A low quoted rate can hide storage fees or extra handling at a border terminal. Ask for a route map. Request recent performance data. Buyers should also check cargo insurance, tracking quality, documentation support, and contingency plans for weather or congestion. Legal compliance remains essential at every crossing, including accurate product descriptions and complete customs records.
Route selection needs more than a published timetable. A direct service may be faster, yet a multi-terminal route can offer better equipment availability. This is easy to miss. I have seen planning decisions change after one terminal introduced a two-day inspection delay. Buyers should compare total landed logistics cost, not only the rail charge. They should also test a small shipment before committing regular volumes. Even reliable corridors experience weak weeks, and that uncertainty deserves a clear place in the purchasing plan.
Global buyers should evaluate railway freight companies through measurable performance, not attractive promises. Eurostat reported approximately 385 billion tonne-kilometres of rail freight movement in the European Union during 2023. This scale makes network capacity important. Ask for route-specific schedules, terminal locations, wagon availability, and average dwell time. A reliable provider should explain what happens when a train misses its connection.
Tracking quality deserves close attention. The World Bank’s Logistics Performance Index 2023 identifies tracking and tracing as a core logistics capability. Request milestone data from booking to final delivery. Test the system with a sample shipment. Can it show the train’s last confirmed location, customs status, and revised arrival time? A polished dashboard is not enough.
Cost comparisons should include fuel adjustments, terminal handling, storage, insurance, and border delays. The ITF Transport Outlook 2024 expects freight demand to rise strongly toward 2050, increasing pressure on infrastructure and capacity. Providers with clear capacity plans may be safer choices. Check safety records, incident reporting, contingency routes, and emissions methods. Ask for independently verified performance data. Some companies report averages that hide difficult corridors. I would challenge that. A spreadsheet can still lie. Review three recent shipments, including one delayed movement, before signing a long-term agreement.
Railway freight leaders in Europe are strongest in cross-border intermodal services. They connect inland terminals, ports, and manufacturing zones with scheduled block trains. Eurostat reported roughly 375 billion tonne-kilometres of EU rail freight in 2023. That figure shows scale, but not service quality. Buyers should examine terminal dwell time, customs coordination, wagon availability, and last-mile coverage. Reliable tracking matters.
In North America, leading operators focus on bulk commodities, automotive flows, and long-distance unit trains. The Association of American Railroads recorded more than 1.7 trillion freight ton-miles in 2023. These networks suit heavy cargo and predictable volumes. In Asia, major railway freight companies support industrial corridors and container services between inland production centers and seaports. The World Bank’s Logistics Performance Index 2023 highlights infrastructure, shipment reliability, and tracking as key performance factors. Price alone is a weak filter.
Service type changes the ranking. Intermodal specialists offer container transfers and port access. Bulk operators provide dedicated wagons, loading equipment, and capacity planning. Express rail providers prioritize shorter transit times between regional hubs. The International Transport Forum continues to identify rail as a lower-emission option for suitable long-haul freight, although results depend on electricity sources and route design. Data coverage remains uneven. Buyers should question optimistic schedules, especially during winter, border congestion, or terminal maintenance. A perfect ranking is impossible. Operational evidence is better.
| Region | Leading Service Profile | Primary Freight Types | Common Track Gauge | Typical Equipment | Cross-Border Capability | Indicative Transit Range | Best Fit for Global Buyers |
|---|---|---|---|---|---|---|---|
| North America | Large-scale bulk, merchandise and intermodal rail networks | Coal, grain, chemicals, automobiles, metals, containers and construction materials | 1,435 mm standard gauge | Covered hoppers, tank cars, well cars, autoracks and boxcars | Extensive Canada–United States–Mexico connectivity through interchange and border gateways | 2–7 days for major domestic corridors; longer for cross-border door-to-door moves | High-volume inland distribution and long-distance bulk transportation |
| Western and Central Europe | Multimodal intermodal, short-sea feeder and conventional freight services | Consumer goods, automotive products, chemicals, food, machinery and containers | Mostly 1,435 mm standard gauge | Container flatcars, pocket wagons, covered wagons and tank wagons | Dense cross-border network across European Union markets; operating rules and paths vary by country | 1–4 days for major regional corridors | Time-sensitive continental freight requiring rail–road integration |
| Eastern Europe and Eurasia | Long-haul block trains, transit freight and industrial bulk logistics | Energy products, grain, metals, timber, fertilizers, machinery and containers | 1,520 mm broad gauge in much of the former Soviet rail area; 1,435 mm in other corridors | Open wagons, covered wagons, tank wagons and container platforms | Strong east–west transit potential, with gauge-change or transloading requirements at selected borders | 5–18 days depending on route, border procedures and transshipment needs | Heavy industrial cargo and long-distance landbridge movements |
| East Asia | High-frequency domestic freight, port rail and international block-train services | Electronics, machinery, automobiles, consumer products, metals and containers | Mainland China and Japan primarily use 1,435 mm; other markets may differ | Container flatcars, double-stack equipment on suitable routes, boxcars and covered wagons | Major port, inland terminal and international corridor connections | 1–5 days domestically; approximately 10–20 days for selected international land routes | Manufacturing supply chains, port drayage alternatives and scheduled container movements |
| South Asia | Bulk commodity rail, domestic container trains and port-to-inland services | Coal, grain, cement, fertilizers, petroleum products, automobiles and containers | India primarily uses 1,676 mm broad gauge; neighboring systems may use different gauges | Open wagons, covered wagons, tank wagons, automobile carriers and container flatcars | Primarily domestic, with limited regional connectivity and interchange constraints | 2–6 days on major domestic freight lanes | Large domestic volumes, raw materials and port-linked inland distribution |
| Southeast Asia | Port rail, industrial corridor and developing cross-border freight services | Containers, agricultural products, minerals, fuel, cement and manufactured goods | Mixed gauges, commonly 1,000 mm metre gauge and 1,435 mm standard gauge | Container wagons, covered wagons, tank wagons and bulk wagons | Regional capability is expanding; gauge compatibility and border handling remain important | 2–8 days for established domestic and regional corridors | Port-to-factory logistics and regional manufacturing supply chains |
| Middle East | Industrial freight, mineral logistics and new port–inland rail corridors | Minerals, petrochemicals, construction materials, containers and general cargo | Newer mainline projects commonly use 1,435 mm standard gauge | Bulk wagons, tank wagons, container flatcars and covered wagons | Primarily national networks with developing Gulf and port-connected interoperability | 1–4 days on operating domestic industrial corridors | Heavy industry, mining exports and inland container distribution |
| Africa | Mining rail, agricultural bulk and port-to-inland corridor services | Copper, iron ore, coal, grain, fertilizer, fuel and containers | Mixed gauges, including 1,000 mm, 1,067 mm and 1,435 mm | Open wagons, hopper wagons, tank wagons, flatcars and container wagons | Corridor-specific; cross-border performance depends on gauge, infrastructure and border coordination | 3–14 days depending on corridor and terminal conditions | Mining exports, agricultural supply chains and inland access to seaports |
| Latin America | Agricultural bulk, mining rail and port-connected intermodal operations | Soybeans, grain, iron ore, coal, automobiles, fuel and containers | Mixed gauges, commonly 1,000 mm, 1,435 mm and 1,600 mm | Hopper cars, open wagons, tank cars, container flatcars and autoracks | Strong corridor-based service; gauge differences can require transloading or equipment changes | 2–10 days on major domestic routes | Export commodities, agricultural logistics and inland port connections |
| Australia | Mining bulk, agricultural freight and east–west intermodal services | Iron ore, coal, grain, fertilizers, minerals and containers | Mixed gauges, including 1,067 mm, 1,435 mm and 1,600 mm | High-capacity ore wagons, coal hoppers, grain hoppers, tank wagons and container platforms | Primarily domestic; port and interstate connectivity varies by state and corridor | 2–6 days for major interstate intermodal lanes | Mining exports, bulk commodities and long-distance domestic container freight |
Global buyers should compare rail freight services by route, cargo profile, and delivery risk. The ITF Transport Outlook 2024 projects global freight demand could reach about 2.3 times today’s level by 2050. Rail can support this growth with scheduled block trains, intermodal containers, and temperature-controlled equipment. However, border checks, terminal queues, and last-mile transfers still affect actual transit time.
Pricing usually combines distance, gross weight, container size, fuel adjustments, terminal handling, customs support, and seasonal capacity. Ask for both an all-in quote and a charge-by-charge breakdown. Transit standards should reference applicable CIM or SMGS documentation, ISO container identification, axle-load limits, and agreed loading gauges. The World Bank Logistics Performance Index 2023 shows major gaps between countries in tracking, timeliness, and logistics reliability. A published schedule is not a guarantee. A 48-hour estimate can still fail after one congested interchange.
Tips: Request three routing options, not one. Confirm free storage hours, demurrage rules, insurance limits, and delivery appointment windows. Use milestone tracking at origin departure, border arrival, terminal release, and final delivery. Keep a small time buffer. Real operations are messier than spreadsheets. My own caution is simple: cost comparisons often ignore inventory delays, which can outweigh a cheaper rail rate.
In 2026, global buyers should evaluate railway freight companies beyond price and transit time. Compliance begins with accurate product classification, origin records, invoices, and required import documents. Each shipment should match the buyer’s customs rules and contract terms. Small errors can delay a container for days.
Ask carriers how they screen routes, subcontractors, terminals, and cargo documentation. A reliable provider should offer shipment milestones, wagon or container references, terminal scans, and delay alerts. Tracking must show more than “in transit.” It should identify where responsibility changes. Buyers can then contact the right operations team quickly.
Risk management needs a written process. Build a route risk matrix covering border congestion, weather, infrastructure limits, currency exposure, and regulatory changes. Confirm insurance limits and liability before booking. Keep backup routes for time-sensitive cargo. That costs more.
A practical audit should sample recent shipments and compare promised data with actual events. Check whether arrival notices were timely and whether missing documents were escalated. Independent customs specialists can review classification and documentation controls. Their feedback may reveal weak supplier practices.
No system is perfect. I have seen tracking dashboards look accurate while terminal updates arrived late. That gap deserves attention. Buyers should record exceptions, assign owners, and review the findings after every major shipment. Clear records support stronger decisions when transport conditions change.